 1-866-985-9791
WHAT THE EVIDENCE SHOWS
Manitoba Trucking Association
Crashes are the ultimate measure of commercial truck safety, but predicting the likelihood of a crash is a big challenge. Starting in 2005 and following up in 2011, 2018, and most recently in October 2022,
The American Transportation Research Institute (ATRI) has published a series of major research papers called Predicting Truck Crash Involvement that assess different types of rule violations as predictors of truck crashes.
In all four papers, the same statistical methods were used, drawing from large sets of truck driver data, safety violation data, and crash data involving large trucks, recorded throughout the United States. In the 2022 report, a data set of well over half a million truck drivers (583,805) was used in the analysis.
This type of research is important for several reasons:
• It shows that driver behaviours are an important predictor of future crashes and that correcting certain behaviours is key to improving highway safety.
• It identifies specific driver behaviours and specific types of traffic and inspection violations that are the strongest predictors of future crashes based on data, not subjective opinion.
• It shows the importance of enforcement actions by peace officers, for both roadside inspections and traffic violations, in reducing the overall number of crashes. Without the record of actions by enforcement officers, there would be no data to prove the connection between driver behaviour and crashes.
Let’s take a look at some of the numbers.
The 583,805 drivers studied in the 2022 ATRI report had over 1.2 million roadside inspections conducted between January 1, 2017, and December 31, 2018.
All of the drivers were licensed in the United States. There was no distinction in the data between the types of heavy trucks driven, the loads carried, or which highways were travelled.
The results of those inspections are broken down in Table 1.
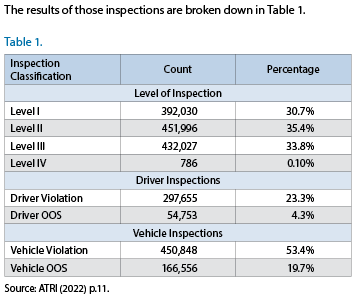
The number of inspections that resulted in one or more vehicle and driver violations is shown, along with the number of trucks and drivers placed ‘out of service.’
As you know, one inspection can result in more than one violation, and in the 2022 report, the 1.2 million inspections led to approximately 1.8 million violations.
Table 2 shows the top 20 violations based on the frequency of occurrence. These 20 violations account for 94.7% of all violations issued.
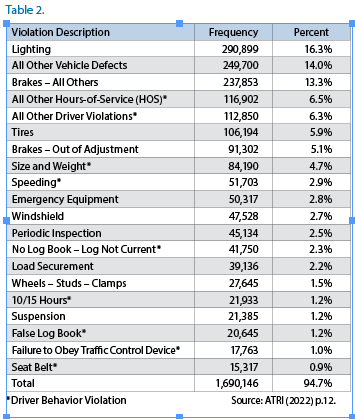
Among the top 20 violations, the driver behaviour violations are marked with an asterisk. Approximately 29% of the total violations were driver violations. The remaining 70% were vehicle violations. This 30/70 split between the two categories was also found in ATRI’s 2018 report, which analyzed data from 2013 and 2014.
The data set of 583,805 drivers was also studied for the number of crashes they experienced between January 1, 2017,and December 31, 2018; the results are shown in Table 3.
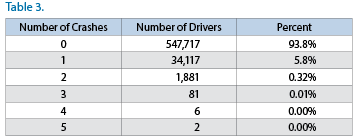
Only 6.2% of the truck drivers were involved in one or more crashes during the two-year period, and only 89 drivers, equivalent to one-hundredth of one percent, were involved in three or more crashes.
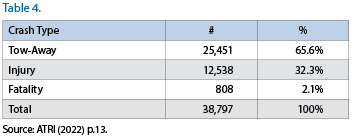
As shown in Table 4, of the 38,797 crashes recorded in the study, 2.1% involved one or more fatalities, and 32.3% involved at least one injury involving immediate medical attention away from the crash scene. The remaining 65.6% were ‘tow-away’ crashes with no fatalities or medical attention injuries.
The data set of 583,805 truck drivers was also studied forthe number of traffic convictions they experienced between January 1, 2017, and December 31, 2018. Because this part of the study involved comparing two data sets, not every driver in one data set was included in the other; those drivers not identified in both sets are shown as ‘Not Matched’ in Table 5.
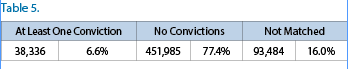
As shown in Table 5, 77.4% of the 583,805 truck drivers had no convictions during the two-year period, while 6.6% had at least one conviction. The remaining 16% were not matched with names in the conviction data set.
When all the conviction and violation records were compared with the crash data, each type of conviction or violation was tested using a statistical method called chi-square analysis to predict the likelihood of a truck driver experiencing a crash.
Table 6 shows, in ranked order, the types of driver behaviour that increased the likelihood of the driver experiencing a future crash.
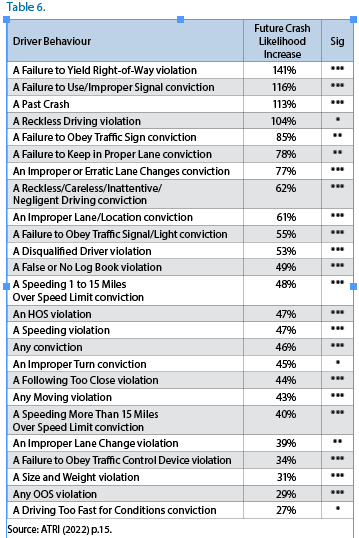
For example, drivers who were convicted of failing to obey a traffic sign were 85% more likely to be involved in a crash than drivers who did not have this conviction on their record. This particular finding had a statistical significance of 0.01, which means that there is only a 1% likelihood of this result occurring purely by chance.
The top predictor behaviour was a violation for failing to yield the right of way to another vehicle. Those truck drivers who committed this violation were 141% more likely to have a future crash. Failing to yield the right of way had a statistical significance of 0.001, which means that there is only a one-tenth of 1% likelihood of this result occurring purely by chance.
There are two important things to remember about these findings. First, some drivers who did not have a particular violation or conviction were not immune to experiencing a crash. For example, 489,820 drivers had zero (0) convictions for failing to yield the right of way, but of this group, 18,609 (3.80%) had a crash. This illustrates the meaningfulness of the word ‘likelihood.’
Second, violations and convictions do not have to occur very often to be strong predictors. For example, only 545 counts of failing to yield the right of way were recorded in the data set, only 0.03% of the total violations recorded, yet this was the strongest predictor of a future crash.
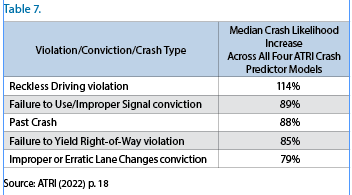
This 2022 report is the most recent of four studies produced by ATRI using this methodology. Across all four studies, some of the most important crash-predicting behaviours kept emerging in the top ten list for each study.
In all four studies, the following two behaviours appeared in the top ten predictors of a future crash:
• An Improper or Erratic Lane Changes conviction
• A Past Crash
In three of the four studies, the following behaviours appeared in the top ten predictors of a future crash:
• A Failure to Keep in Proper Lane conviction
• A Reckless Driving violation
• A Failure to Use/Improper Signal conviction
• A Failure to Yield Right-of-Way violation
• A Reckless/Careless/Inattentive/Negligent Driving conviction
Across all four studies, the top five most stable predictors of crash risk were the following behaviours, shown in Table 7.